
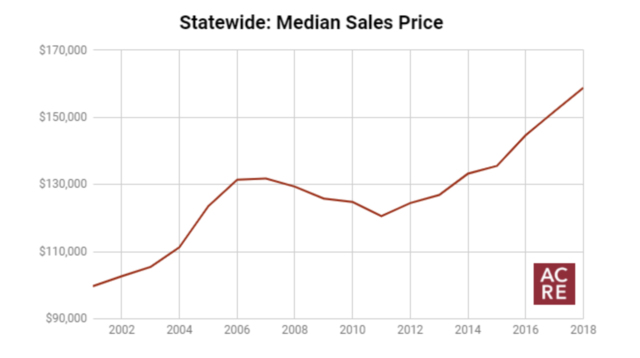
Alabama’s residential market is substantially impacted by inventory, the amount of homes listed for sale at any given moment. Inventory* levels impact months of supply, median sales price, and DOM (Days On Market). These factors are all heavily influenced by inventory levels and are important metric tools to determine if it is a buyer’s or seller’s market. In the lead up to the Great Recession, for example, inventory was abundant and seller’s competed with one another for a limited number of buyers. Not surprisingly, this was one factor that lead to declining home values from 2007 to 2011 when the statewide median sales price declined 8.5%. Alabama’s residential market today is quite different, mostly because inventory levels have been tight for several years now, while total sales are at record levels. According to the Center’s most recent Statewide Annual Report, the average number of homes on the market peaked in 2008 with approximately 41,200 listings. From that peak, inventory consistently trended downwards with approximately 23,600 listings in 2018, a decline of 42.8% from peak levels and a 9.4% decrease from the previous year. That slow yet important shift in the number of homes on the market has many implications, two of which are homes selling faster and at higher prices.
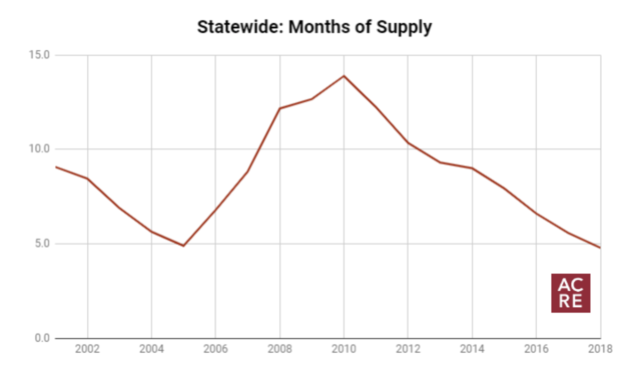
One of the best indicators for residential markets is the inventory to sales ratio, also referred to as months of supply (MOS). Inventory to sales ratio is calculated by dividing the total number of units listed on the market for a specific term and dividing that by the number of closed transactions from that same term. The statewide MOS for the month of August 2019 is 3.4 months, down 18.7% from one year ago. For comparison, the inventory to sales ratio in August 2010 was 13.9 months, meaning that buyers were relatively scarce (2,983 transactions statewide) when compared to the inventory at the time (41,449 listings). Months of supply and median sales price typically have an inverse relationship, reacting to changes in supply and demand. This is why markets with much lower MOS have significantly levels of price appreciation. Since 2010, MOS has slowly dwindled to where it is today (3.4 months), and in that same time period median sales price has increased an average of 4.5% per year.
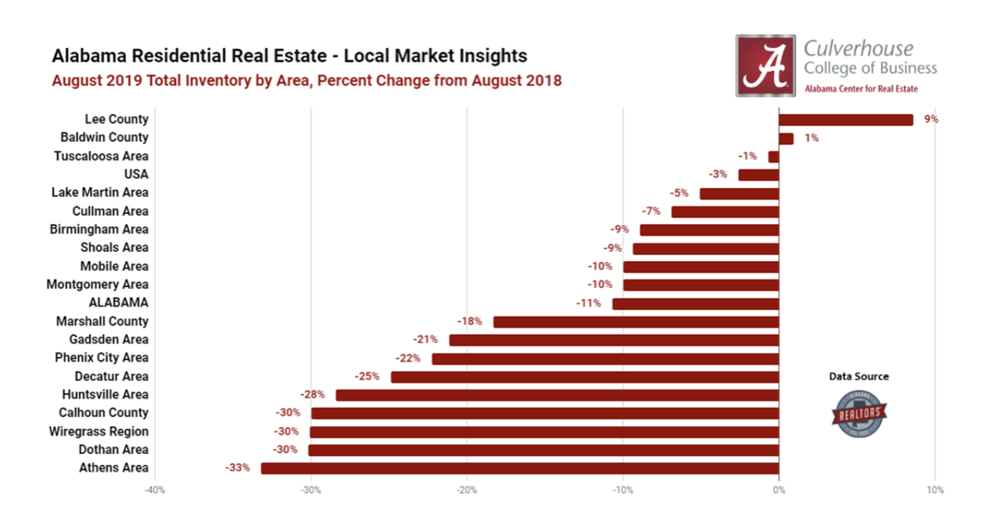
Nationwide, available inventory is starting to tighten as listings declined 2.6% Y/Y in August. . Alabama’s residential markets, however, are impacted by significantly larger declines as listings statewide declined 12.6% Y/Y. Only two of Alabama’s 14** metropolitan areas witnessed a Y/Y inventory gain in August: Auburn-Opelika (8.6%) and Daphne-Fairhope-Foley (0.9%). Inventory gains in these areas are driven in part by a strong new construction markets. During August, new construction represented 32.7% of all residential sales in Auburn-Opelika and 18.4% in Daphne-Fairhope-Foley.
As mentioned earlier, Alabama’s inventory is steadily trending downwards, declining 12.6% Y/Y in August. This extends the year-over-year statewide inventory decline to 54 months, a trend that began in March 2015. North Alabama is feeling the greatest burden of inventory shortages, dropping 28.4% Y/Y in Huntsville, 33.2% in Athens, and 24.9% in Decatur. Strong economic output partnered with steady population and job growth have increased demand for housing in the area. The new Mazda Toyota factory located in Limestone County will bring over 4,000 new jobs to the area, further extending this trend. Other markets seeing significant inventory declines in August include Montgomery (down 10%), Dothan (down 30.2%), and Phenix City (down 22.3%). Listings in the Mobile area are also trending downwards, as August’s 10% decline extends the areas streak of year-over-year inventory declines to 70 consecutive months. This is the longest streak of such inventory declines in the state, a trend that began in November 2013.
The following chart ranks Alabama’s metropolitan areas based on their total months of supply during August 2019. Strong sellers markets include Huntsville (1.5 MOS), Athens (1.6), Decatur (1.9), Tuscaloosa (2.9), Mobile (2.9), and Auburn-Opelika (3.0). Given that 6.0 months of supply is generally considered the equilibrium point where buyers and sellers have roughly equal bargaining power, all of Alabama’s metro areas are currently “seller’s markets.” Stay tuned to ACRE’s exploRE page to stay up to date on inventory trends in Alabama’s residential markets.