
This first week of April might have us awakening to a belief that the morning CNBC or Bloomberg economic news is an “April Fool’s” joke with this first wave of COVID19 influenced economic data – data which has multiplied weekly Jobless Claims by a factor of 20 (300,000 to 6.6 million), and cut annualized auto sales by one-third (16.8 million units to 11.4 million), and is reporting the lowest ISM Manufacturing reading since 2009. No, it is not a latent April Fool’s Day joke; and neither is it apocalyptic if you look beneath the surface.
Let us start with the sequence of what has been revealed since April 1st. First up, ISM manufacturing data followed by: i) ADP Private Payrolls data and another record Jobless Claims report double that of last week’s record; and then March’s auto sales.
ISM Manufacturing
Until this week’s refreshed Jobless Claims that doubled last week’s record 3.2 million claims, March’s ISM manufacturing data was this week’s eye-popping economic metric. According to the Institute for Supply Management (ISM) the following was noted for this first month of COVID19 disruption under “Shelter-In-Place” orders:
- The Institute for Supply Management PMI manufacturing PMI for March was 49.1% (readings below 50% indicate contraction/recession).
- The index measuring employment in the sector contracted for the eighth month in a row, to 43.8% from 46.9%, and at a faster rate this month than before. 43.8% represents the employment index’s worst reading since May 2009. Only 3 of 18 industry sectors surveyed reported an increase in employment: printing and related support activities, food and beverage companies, and electronics.
- New orders contracted 7.6 percentage points from 49.8% in February to 42.2% in March, an 11-year low compared to March 2009, when the index recorded 41.3%. A respondent from the Plastics and Rubber Products sector said that all of their North American manufacturing plants had ceased operations or dramatically scaled them back. One surveyed executive in the machinery sector said COVID-19 was to blame for a “30% reduction in productivity” in their factory. Factory backlogs shrank, and the ISM’s backlog index fell 4.4 points to 45.9%.
- The ISM’s factory production index slid 2.6 points to 47.7% in March. One surveyed executive in the machinery sector said COVID-19 was to blame for a “30% reduction in productivity” in their factory. Factory backlogs shrank, and the ISM’s backlog index fell 4.4 points to 45.9%. In general, the dearth of new orders for factories sent aftershocks through other metrics. As no new orders came in, factories had little to do.
Here are the three key takeaways that lie beneath the surface regarding manufacturing that suggest “Look Up & Forward” is the right attitude. First, as expected, food & beverage and electronics were what held up. That trend will persist into April, but then things may broaden out. Why? The answer is the second key takeaway – we are rapidly depleting inventories that will need rebuilding in 2H2020. Just consider the volume of medical supplies, PP&E, and consumer staples that are being consumed during the virus’ outbreak that has yet to peak. And the third reason to be a bit more “Look Up & Forward” about manufacturing is the retooling in factories from making apparel and cars to masks and ventilators. We haven’t seen the retooling impact in this ISM data yet.

ADP National Employment Report for March Private Payrolls and Jobless Claims
The ADP report is a precursor for today’s Bureau of Labor Statistics (BLS) jobs report for the Feb 13 to March 12th period. The good news is that it was a lot less terrifying than this week’s Jobless Claims. The BLS jobs report today will likely be similar. According to ADP, “Private sector employment decreased by 27,000 jobs from February to March.” The three key points to note here are:
i. The ADP report utilizes data through the 12th of the month, or the same time period the Bureau of Labor and Statistics uses for their monthly jobs survey. There is no difference in survey period to cause a distortion between the two employment reports.
ii. The March ADP report does not reflect the full impact of COVID-19 on the overall employment situation as it only covers a period up to March 12th that precedes the plethora or “Shelter-in-Place” orders nationwide. In other words, this is the tip of the iceberg in job loss. Much worse data is ahead in April.
iii. Every employment sector lost jobs except Education & Healthcare. Remote learning kept teachers employed and the spreading COVID-19 virus put strains on healthcare workers like we have not seen since WWII.

With respect to Jobless Claims, it was another awful week; however, the high numbers could be distorted by the fact that for the first time ever, sole proprietors are eligible to file claims and for unemployment benefits. This is a new twist that skews the claims figures upward and makes them distorted for historical comparisons. That means an estimated 56 million sole proprietor businesses may be filing for benefits. It is critical we understand the distortions in some of the data we are going to be receiving as a result of the unprecedented $2.2 trillion CARES bill. So what were the numbers and how might they NOT filter into the unemployment figures today in the BLS Employment Situation report?
According to Bloomberg’s coverage, “the number of Americans applying for unemployment benefits soared to a record 6.65 million last week, a level unimaginable just a month ago. As states shut down commerce to prevent the deadly coronavirus from spreading, the weekly claims data have been among the first detailed figures to show the devastating economic hit, highlighting the extent to which U.S. businesses and workers are reeling from the global health crisis.” And the chart to accompany the headline is below:

The three takeaways to digest from today’s BLS Employment Situation report not appearing in the headline or chart are:
i. We are not comparing apples to apples any more with sole proprietors able to file for unemployment benefits and make claims.
ii. The ADP and BLS periods only cover half of March, so the job loss numbers are not reflective of the impact from the expansion of “Shelter-In-Place” orders. It will likely be a much uglier figure in April and May.
iii. The unemployment rate in the BLS report may surprise as not spiking to 10% or 20%. Why? You are ineligible to file for unemployment until any paid leave or severance benefits are depleted. Many corporations are continuing to pay impacted employees for 2, 4, or more weeks. Additionally, how is the BLS going to factor in the payments from the CARES bill in unemployment calculation? In other words, look for a lot of song and dance by media economists Friday over the BLS jobs report. I am forecasting -100,000 jobs, a rise in unemployment from 3.5% to 7%-9% and the U-6 unemployment rise will only move up from <7% to maybe 9%-10%.
Hopefully these beneath-the-surface perspectives prepare you for the end-of-week BLS jobs report.
Auto sales
When examining auto sales, it is important to NOT extrapolate auto sales activity as a proxy for the housing market. There are two key points to extract from the auto sales data this week: i) it is very different from 2009 from a manufacturing perspective; and ii) auto sales are not a proxy for what may follow in housing.
Thursday April 2, 2020, the market learned that GM and FIAT/Chrysler auto sales declined 7% and 10%, respectively and that the March annualized total sales fell by one-third from 16.8 million units to just 11.37 million vehicles. Unfortunately, this decline is just the beginning. The decline will get worse and last for quarters as consumers savings and credit scores decline. We will likely challenge the 8-10 million unit lows evidenced in prior recessions, such as 1971, 1981, 1991 and 2009. The difference this time is that it is not a result of high energy prices or the wrong product competing with say, Japan. This time it will result from declining consumer confidence, lost savings, and less need for replacement as the average age of the American car is 2-3 years younger than 2009. The replacement need will be much less after COVID-19. We may not see 17 million units again for years.
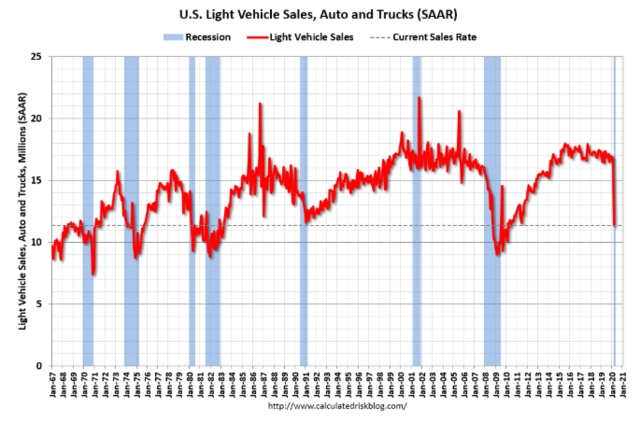
Source: Calculated Risk
While the auto industry may look like 2009 again from the perspective of excess inventory and aggressive financing, the manufacturers have a different opportunity to convert from making cars to medical equipment. That’s good for the manufacturing end of the auto industry, but not-so-much for the dealers bloated with inventory. Government and Federal Reserve intervention will be required as the banks finance a majority of the inventory, and then facilitate the ultimate placement of those auto loans via securitization. There is more optimism for the auto makers as they pivot to manufacturing medical equipment (such as ventilators) and PPE (Personal Protective Equipment) like masks and plexiglass screens for grocers and point-of-purchase retail. Hopefully Congress and the Fed learned from the “Cash for Clunkers” intervention in 2009 that decimated the used car and auto parts markets. Used car prices skyrocketed as all traded-in vehicles had to be destroyed with no ability to even harvest parts – not even airbags or catalytic converters. From the dealers’ perspective, look to see if Carvana and TruCar perform better with online shop and home delivery model. Unlike housing, virtual car shopping model should not matter for auto sales. The 17 million annual auto sales figure will plummet in 2020 by 20%, 30% or more. The incentives in 2H2020 will be something to watch as we already have 0% and 8-year term financing. What more can the auto industry do to sell cars with low rates, incentives and longest-ever duration in financing terms to lower payments? They will need to wait on consumers to rebuild savings and age the vehicles all replaced since 2017.
Although both items – cars and houses – are tied to consumer confidence, auto purchases are not a proxy for housing sales as they are much more discretionary than housing. We entered this COVID-19 public health crisis with a shortage of housing, but a surplus of new auto inventory. While both entities will utilize more virtual marketing and online transaction technology, it will be far less effective for auto sales. Consumer confidence will matter more. And, we have a housing shortage vs an auto inventory glut.