
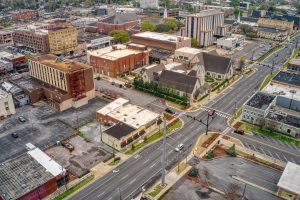
Tuscaloosa Area
Tuscaloosa area home sales are down 5.5% year-over-year in July
According to the Tuscaloosa Association of Realtors, July home sales in the area were down 5.5% year-over-year to 258 closed transactions. Sales decreased by 14.6%

According to the Tuscaloosa Association of Realtors, July home sales in the area were down 5.5% year-over-year to 258 closed transactions. Sales decreased by 14.6%
According to the Tuscaloosa Association of Realtors, June home sales in the area were up 8.6% year-over-year to 302 closed transactions. Sales decreased by 4.7% from May. Two more resources to review: Quarterly Report and Annual Report. For all Tuscaloosa-area housing data, click here. Inventory: June listings (883) decreased 5.5% from May and increased 24.5%
According to the Tuscaloosa Association of Realtors, May home sales in the area were up 7.1% year-over-year at 317 closed transactions. Sales Increased 34.3% from April. Two more resources to review: Quarterly Report and Annual Report. For all Tuscaloosa-area housing data, click here. Inventory: May listings (934) increased 2.6% from April and increased 37.2%
According to the Tuscaloosa Association of Realtors, April home sales in the area were down 17.2% year-over-year at 236 closed transactions. Sales decreased 13.9% from March. Two more resources to review: Quarterly Report and Annual Report. For all Tuscaloosa-area housing data, click here. Inventory: April listings (910) decreased 1.2% from March and increased 30.2%
According to the Tuscaloosa Association of Realtors, March home sales in the area were up 19.1% year-over-year at 274 closed transactions. Sales increased 22.9% from February. Two more resources to review: Quarterly Report and Annual Report. For all Tuscaloosa-area housing data, click here. Inventory: March listings (921) increased 15.3% from February and increased 35.9% from
According to the Tuscaloosa Association of Realtors, February home sales in the area were up 4.7% year-over-year at 223 closed transactions. Sales increased 47.7% from January. Two more resources to review: Quarterly Report and Annual Report. For all Tuscaloosa-area housing data, click here. Inventory: February listings (799) increased 3.5% from January and increased 13.8% from
According to the Tuscaloosa Association of Realtors, January home sales in the area were up 13.2 % year-over-year at 151 closed transactions. Sales decreased 39.8% from December. Two more resources to review: Quarterly Report and Annual Report. For all Tuscaloosa-area housing data, click here. Inventory: January listings (772) increased 3.6% from December and increased 11.1% from
According to the Tuscaloosa Association of Realtors, December home sales in the area were up 17.8% year-over-year at 251 closed transactions. Sales increased 42.6% from November. Two more resources to review: Quarterly Report and Annual Report. For all Tuscaloosa-area housing data, click here. Inventory: December listings (745) decreased 5.3% from November and increased 14.6% from
According to the Tuscaloosa Association of Realtors, November home sales in the area were down 10.7% year-over-year at 176 closed transactions. Sales decreased 10.7% from October. Two more resources to review: Quarterly Report and Annual Report. For all Tuscaloosa-area housing data, click here. Inventory: November listings (176) decreased 9.3% from October and increased 15.7% from
According to the Tuscaloosa Association of Realtors, October home sales in the area were down year-over-year at 197 closed transactions. Sales decreased 6.6% from September. Two more resources to review: Quarterly Report and Annual Report. For all Tuscaloosa-area housing data, click here. Inventory: October listings (197) decreased 21.8% from September and decreased 6.6% from