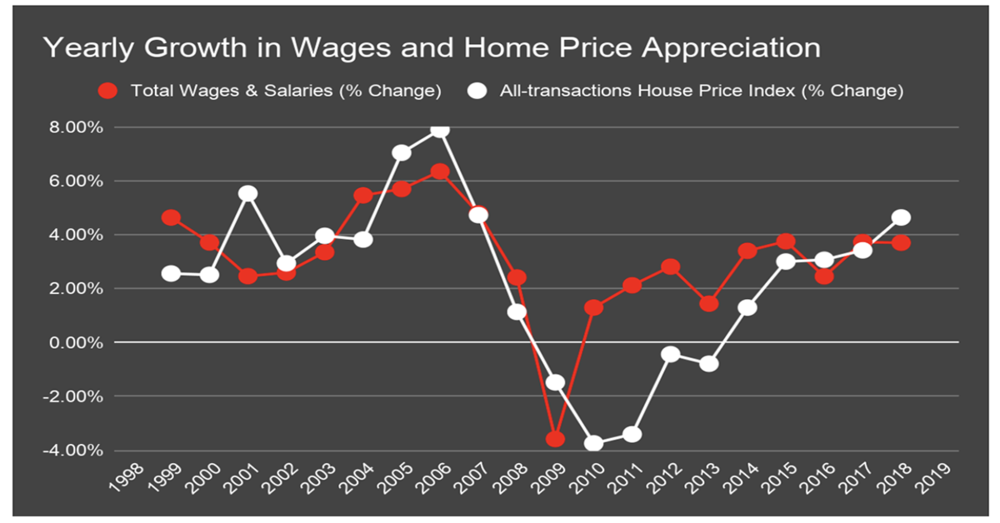
As total wages and salaries in Alabama have been on a steady climb since 1998, the cost to purchase a home has shown a similar pattern of growth. On average, total wages and salaries increased 3.13% per year and the all-transactions House Price Index score (HPI) has increased 2.39%. According to the Federal Housing Finance Agency, “The FHFA House Price Index (HPI) is a broad measure of the movement of single-family house prices. The HPI is a weighted, repeat-sales index, meaning that it measures average price changes in repeat sales or refinancings on the same properties”. Essentially, the HPI score serves as an indicator of price trends in a given geographic area. The percent changes in these price trends each year can be compared to the percent changes in total wages and salaries for Alabama to show somewhat of a relationship between the two.
When analyzing the graph shown above, one can clearly see that the percent changes in total wages and salaries and HPI have some sort of relationship. The financial crisis of 2008 is a perfect example of this. The state saw its only negative total wages and salaries change in 2009, the year immediately following the financial crisis. The percentage change in HPI scores for the state also fell below zero in the years 2009-2013.
A similar trend can be seen throughout the major metro areas of Alabama. Birmingham, Mobile, Montgomery, and Huntsville all show a correlation between wage growth and HPI score that follows the same general trend as the entire state.
Birmingham-Hoover
Birmingham-Hoover is Alabama’s largest metropolitan area and accounted for $6,622,859,497.90 (6.80%) of Alabama’s total wages and salaries for 2018. The average yearly percent change of total wages and salaries is 3.15% and the average percent change for the all-transactions House Price Index is 2.63% annually. Birmingham-Hoover also has the highest average total wages and salaries over the past 20 years. The city has an average total wages and salaries of $5,048,225,955 which is over two times the amount that the next closest metro area (Huntsville) reported.

Mobile
The city of Mobile is another major Alabama metro area that has seen consistent positive growth in both total wages and salaries, and HPI scores. Mobile averages 2.87% growth each year in total wages and salaries, and 2.45% growth in HPI scores. With the exception of 2010 and 2011, the data in the graph below follows the same pattern of growth as Alabama and the other metro areas analyzed. The total wages and salaries in Mobile have risen by $870,441,147 (74.96%) since 1998, and the HPI score for the city has risen by 68.66 points, or 59.03%.

Montgomery
With an average growth rate of 2.93% per year for total wages and salaries, and an average of 1.37% growth for HPI score, Montgomery has seen slower overall growth than many of the other cities analyzed. Alabama’s capital city made up 1.86% of the total wages and salaries reported in 2018 and has the lowest average yearly growth rate of housing costs, meaning that housing is generally more affordable in the area. Since 1998, Montgomery’s total wages and salaries have risen $790,506,972 (77.4%) and their HPI score has risen 68.66 points (30.27%). Compared to some of the other major metro areas of Alabama, Montgomery has seen a high rate of growth in total wages and salaries and a relatively low growth in HPI score, meaning people’s wages are rising faster than the cost of purchasing a home.


