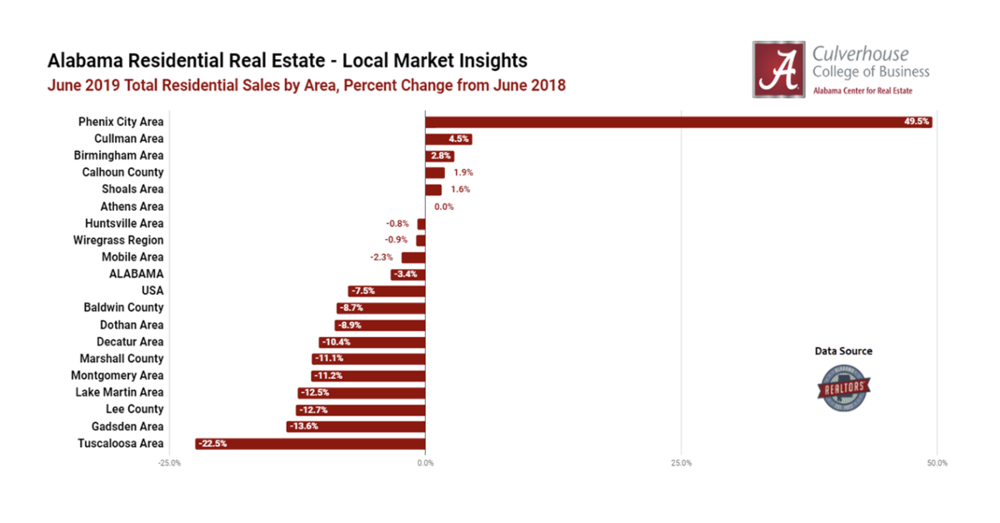
The Alabama Center for Real Estate created the following rankings based on year-over-year (Y/Y) growth in total residential sales during June.
- 1. Phenix City Area: 49.5%
- 2. Cullman Area: 4.5%
- 3. Birmingham Area: 2.8%
- 4. Calhoun County: 1.9%
- 5. Shoals Area: 1.6%
Alabama: -3.4%
United States: -7.5%
Phenix City Area: Total residential sales in the Phenix City area increased 49.5% (Y/Y) from 105 to 157 closed transactions. The June median sales price increased 10.4% (Y/Y) from $158,500 to $175,000, and decreased 1.4% from last month. Dollar Volume made a significant increase of 37.96% (Y/Y) from $17.8 million to $24.4 million. Inventory, however, decreased 16.4% (Y/Y) from 470 residential listings one year ago to 393 in June. The higher median price and lower supply creates a good market for sellers. Additionally, the average days on market (DOM) increased from 97 to 99, a 2.1% (Y/Y) increase . Lastly, months of supply decreased 44.1% during the same period from 4.5 to 2.5 months, still reflecting a seller’s market in the area.
Cullman Area: The Cullman area experienced a 4.5 % increase (Y/Y) in total sales in June, increasing from 88 to 92 closed transactions. The June median sales price increased 18.2% (Y/Y) from $144,900 to $171,200, the median sales price since May has increased by 3.1%. Dollar volume increased 7.56% (Y/Y), increasing from $15.6 million to $16.8 million. Cullman saw a 1.6% (Y/Y) decrease in inventory, going from 490 to 482 units. The average days on market (DOM) saw a decline, as it decreased 10.2% (Y/Y) from 118 to 106. The average months of supply in Cullman also decreased 5.9% during the same period, going from 5.6 months to 5.2 months, creating a slightly stronger market for sellers.
Birmingham Area: The Birmingham Area experienced a 2.8% increase (Y/Y) in total sales in June, increasing from 1,538 to 1,581 closed transactions. The June median sales price increased 4.9% (Y/Y), improving from $219,250 to $230,000. The area also experienced an increase in Dollar Volume of 8.34% (Y/Y), rising from $391.8 million to $424.4 million. The Birmingham Area’s inventory decreased 6.2 % (Y/Y), from 5,738 homes listed last year to 5,381 currently. The Birmingham Area also experienced a significant decrease in average days on market (DOM) in June from 45 in June 2018 to 30 in June 2019, a 33.3% (Y/Y) decrease. Lasty, the months of supply had a slight decrease from 3.7 months to 3.4 months, creating a stronger seller’s market in the area.
Calhoun County: Total residential sales in Calhoun County increased 1.9% (Y/Y) from 159 to 162 closed transactions. The June median sales price increased 12% (Y/Y) from $124,900 to $139,900 currently. Dollar Volume saw a significant increase, rising 15.95% (Y/Y) from $22.3 million to $25.9 million. Inventory in the area continues to decrease with a 16.6% (Y/Y) decrease, decreasing from 727 to 606. Calhoun County had a significant decrease in average days on market (DOM) with a decrease of 16.7% (Y/Y) from 84 to 70. Calhoun County’s months of supply also declined, falling 18.2% (Y/Y) from 4.6 to 3.7 months, reflecting a seller’s market in the area.
Shoals Area: Residential sales in the Shoals Area increased 1.6% (Y/Y) from 187 to 190 closed transactions. The Shoals Area June median sales price increased 0.4% (Y/Y), increasing from $134,900 to $135,450. Dollar volume increased 1.57% (Y/Y), seeing gains from $30.1 million to $30.8 million. The Shoals Area saw an 8.4% (Y/Y) decrease in inventory from 917 to 840 units. The area’s average number of days on market (DOM) decreased 8% (Y/Y) from 75 to 69 days. In addition, the months of supply in the Shoals Area decreased by 9.8% during the same period from 4.9 to 4.4 months, indicating a stronger seller’s market in the area.