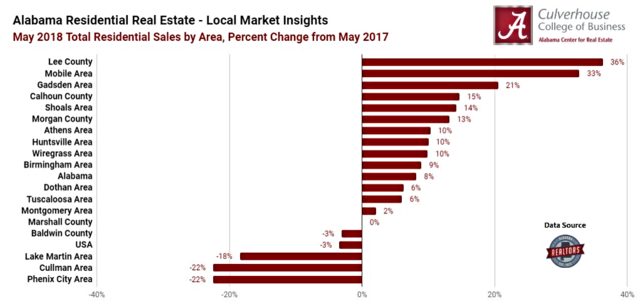
Lee County led Alabama residential markets with 36.3 percent growth year-over-year in total residential sales. Year to date, there were 820 closed transactions in the area, representing a 27.3 percent improvement from the 644 total sales through May 2017. A large share of new construction sales (22 percent) contributed to overall sales growth in Lee County. Supply is getting thin, however, as there were 2.0 months of supply in May.
The Mobile area was second overall and first among large metropolitan areas in residential sales growth with a 32.1 percent increase from May 2017. Year to date, there were 1,613 closed transactions in the area, representing a 9.5 percent improvement from the 1,473 total sales through May 2017. Although new construction represented only 6 percent of May sales, neighboring Baldwin County’s new construction market remained strong with 21 percent. Following national and statewide trends, inventory in the area is down 9.7 percent year-over-year, and properties are selling fast as the average sale spent 91 days on the market, a significant improvement from 137 days one year ago.
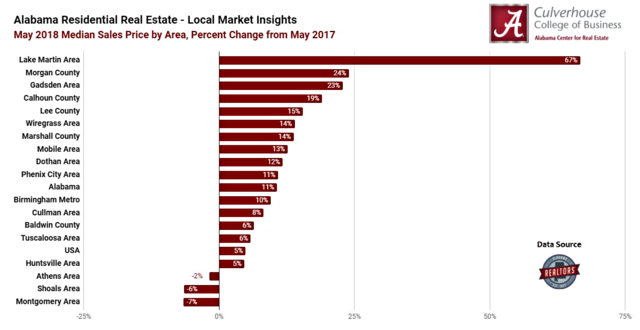
With 62 total sales during May, the Lake Martin area is a relatively small market, making large swing in year-over-year price growth more likely than in larger markets. While the median sales price in the area was $325,000 during May, year to date it is $240,250, representing a 9.6 percent increase from 2017.
Home values are rising in both Alabama and the United States, and it is not surprising to see 15 of 18 markets reporting year-over-year growth in median sales price. With 10.7 percent growth statewide, Alabama’s residential markets were somewhat hotter than the nation as a whole which grew by 4.9 percent. Stay tuned to see if this trend continues in June.

The total number of residential listings nationwide dropped 6.1 percent from one year ago. In Alabama, however, inventory was down 7.3 percent during May. Inventory declined in 13 of 18 markets, and this shortage of listings is playing a major role in driving sales prices upwards. Although the Montgomery area saw a large increase in inventory, it is a different story in other major metropolitan areas. During May Huntsville’s inventory was down 25.6 percent, Mobile’s was down 19.4 percent, and Birmingham’s was down 13.7 percent.
As one of Alabama’s hotter markets, Baldwin County is going against the grain when it comes to inventory. While inventory drops are the norm in most areas, Baldwin County has seen year-over-year inventory growth for 8 consecutive months going back to October 2017.

Although Alabama’s days on market average improved from 123 days in May 2017 to 101 days in May 2018, we still trail the nation as a whole in this category. Nationwide, properties selling in May spent an average of 55 days on the market, representing an 8.3 percent improvement from 60 DOM one year earlier.
Two Alabama markets beat the nationwide average of 55 DOM during May: Birmingham with an average of 47 DOM and Lee County with an average of 52 DOM. Not surprisingly, 17 of 18 markets reported year-over-year improvements in average days on market. Properties are selling faster than previous years due mainly to inventory declines in a majority of the state’s markets.

Alabama passed an important benchmark during May as there were 3.9 months of supply statewide. This marks the first time since ACRE began keeping records that statewide months of supply dropped below 4.0.
Alabama’s markets with the least months of supply include Lee County with 2.0, Huntsville with 2.3, and Athens and Tuscaloosa with 2.7.
Stuart Norton is the Research Coordinator at the Alabama Center for Real Estate