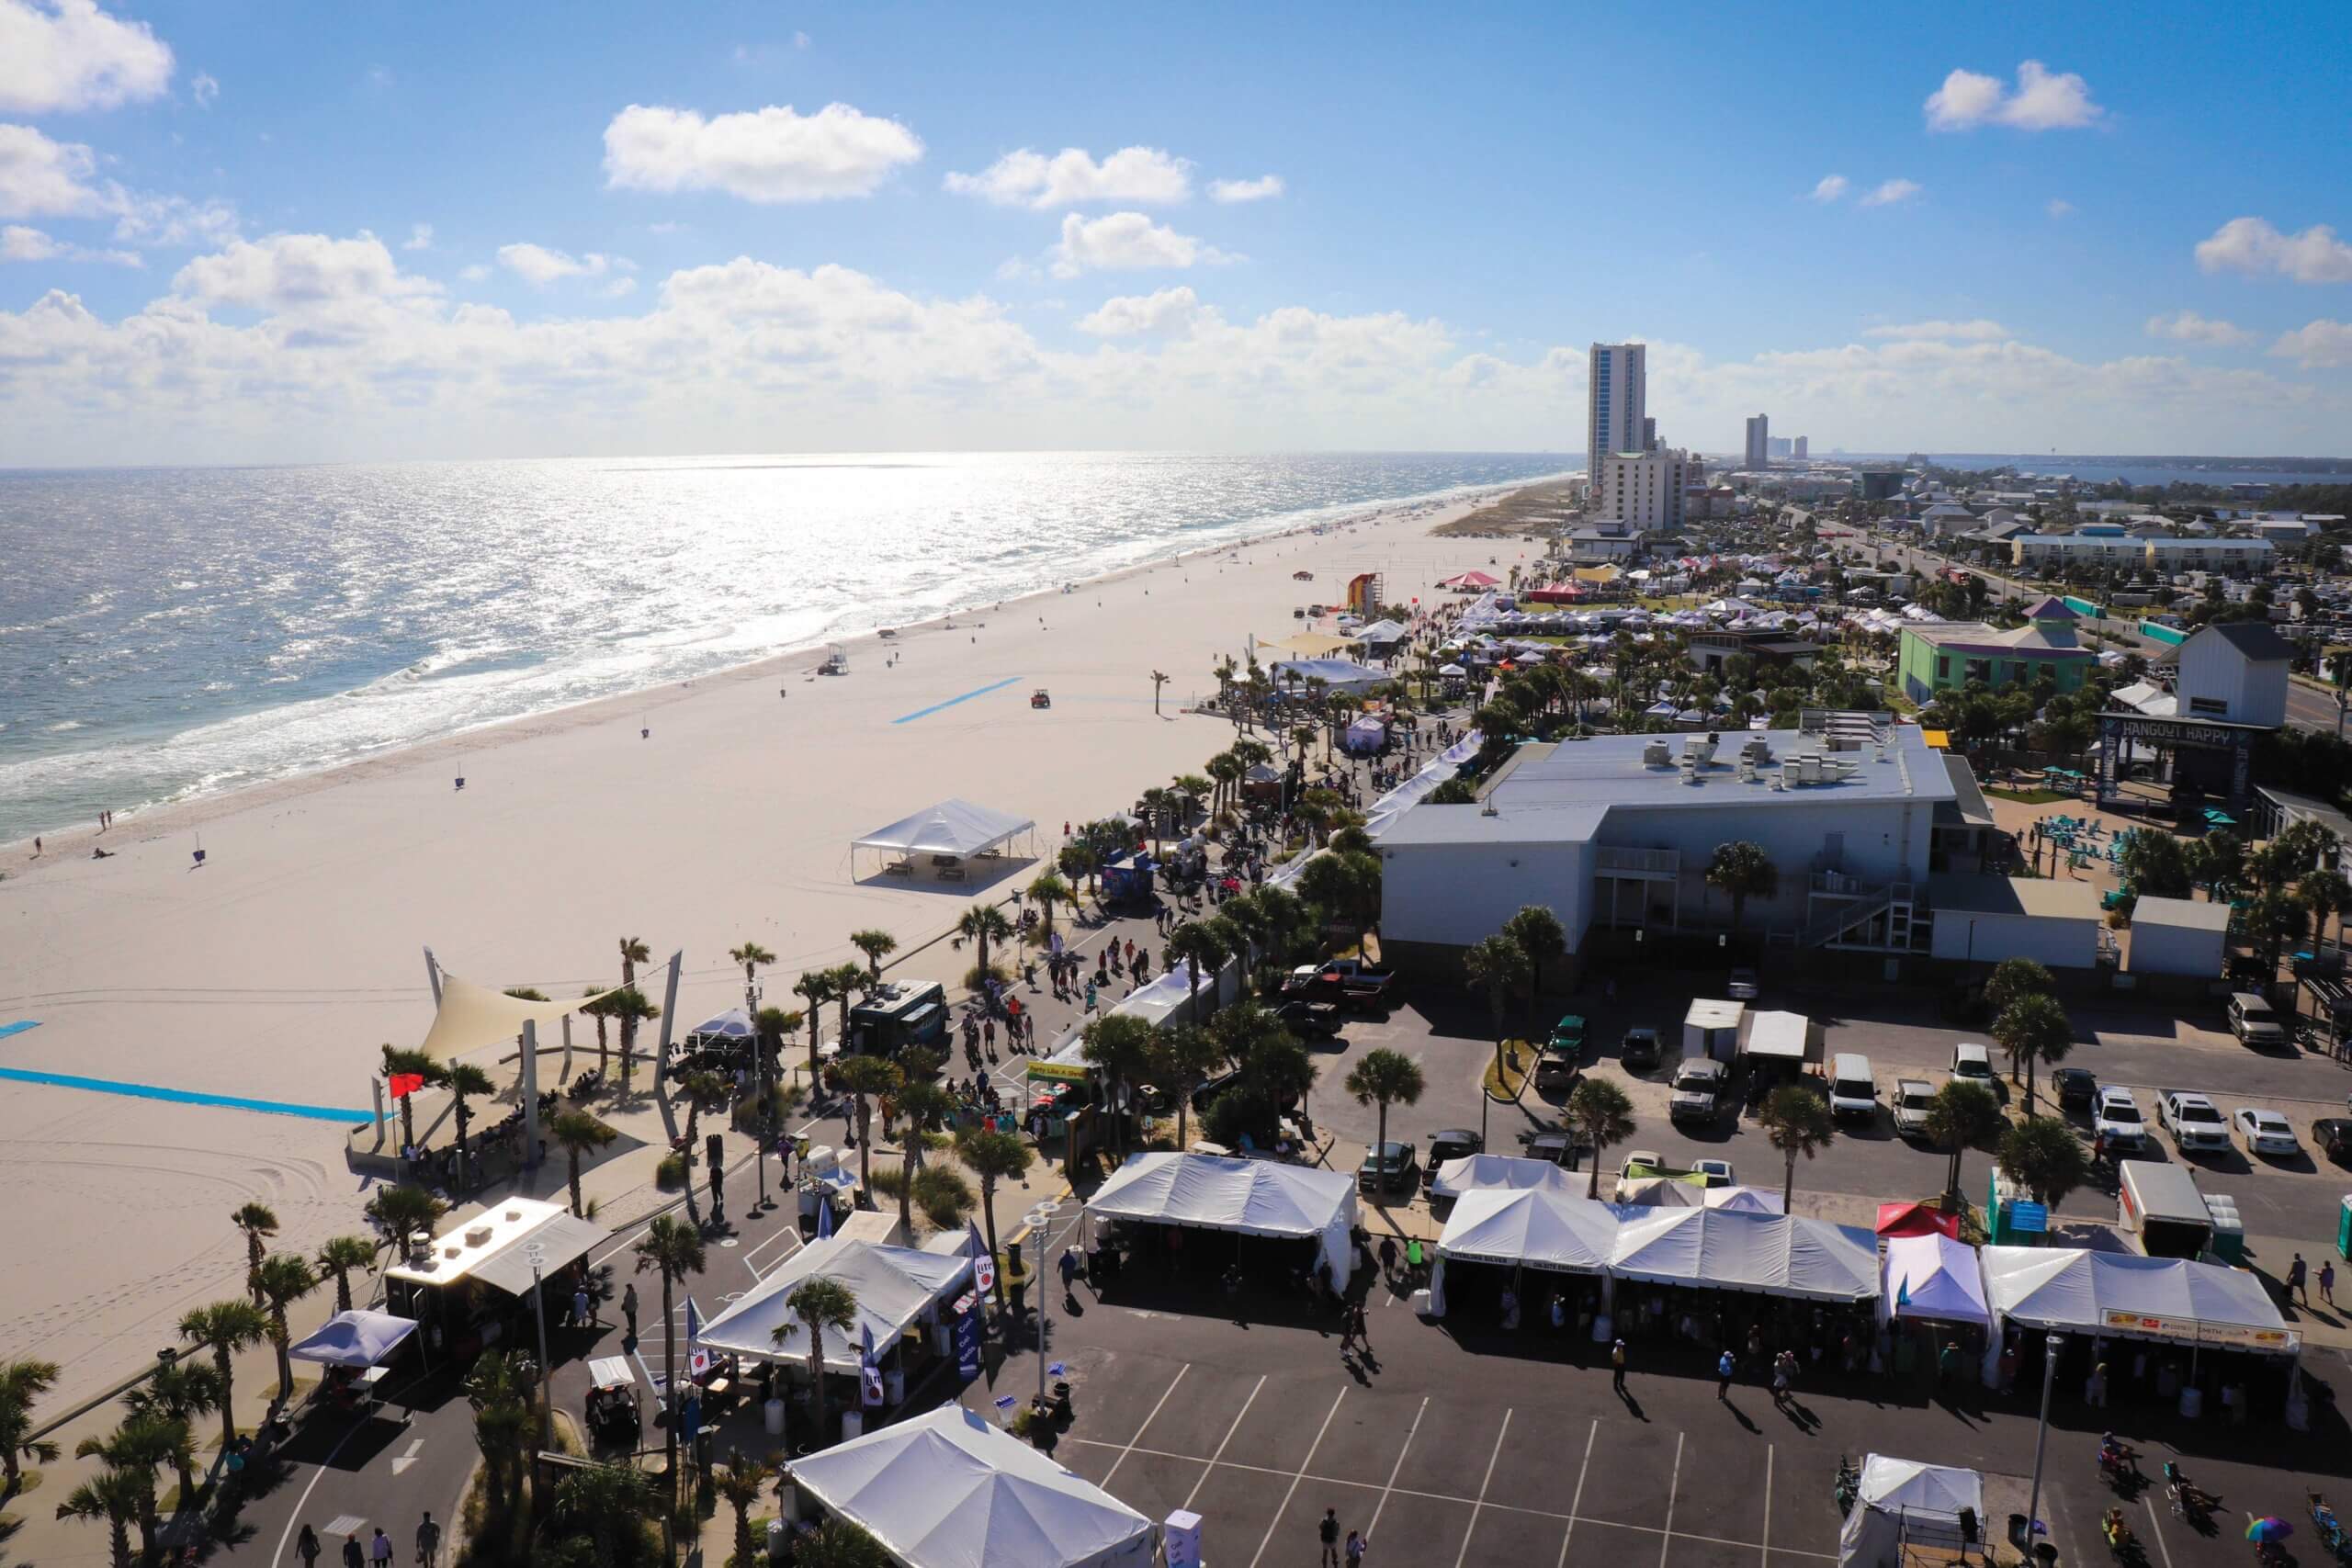



Lake Martin’s Waterfront Home Sales Rise year-over-year 24.1% in July
According to the Lake Martin Area Association of Realtors, waterfront home sales during July increased 24.1% year-over-year from 29 to 36 closed transactions. Following seasonal
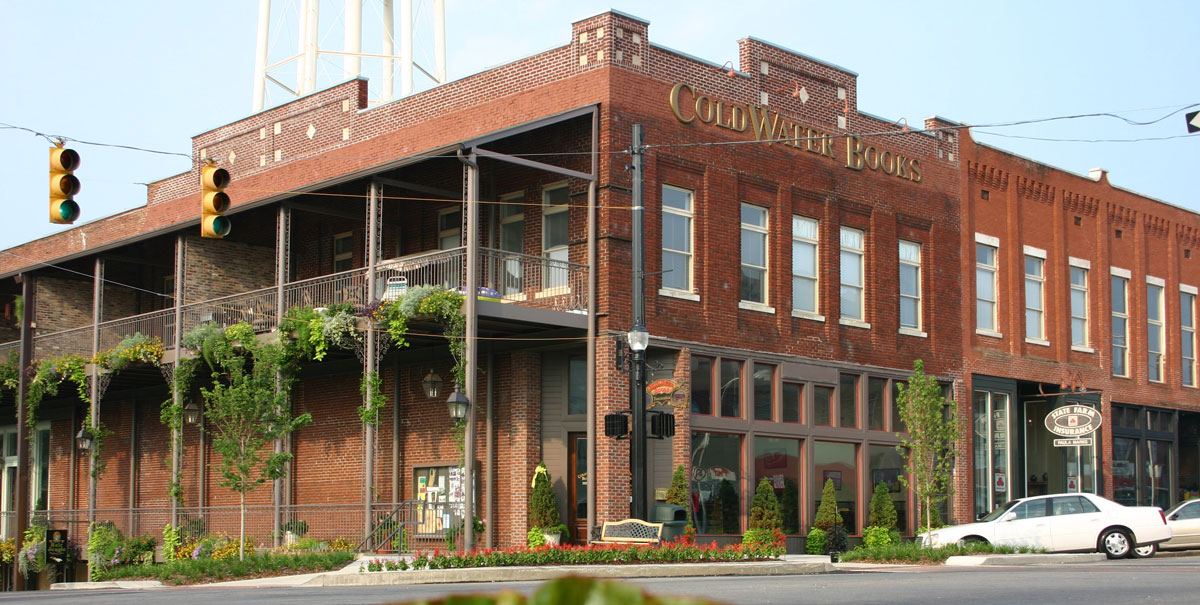

According to the Lake Martin Area Association of Realtors, waterfront home sales during July increased 24.1% year-over-year from 29 to 36 closed transactions. Following seasonal

According to the Lake Martin Area Association of Realtors, waterfront home sales during May increased 27.6% year-over-year at 37 closed transactions. Sales increased by 54.2% from April. For all the Lake Martin Waterfront housing data, click here. Inventory: May listings (219) increased 6.3% from April and increased 11.7% from one

According to the Lake Martin Area Association of Realtors, waterfront home sales during April increased 14.3% year-over-year at 24 closed transactions. Sales decreased by 4.0% from March. For all the Lake Martin Waterfront housing data, click here. Inventory: April listings (206) increased 7.9% from March and increased 4.0% from one

According to the Lake Martin Area Association of Realtors, waterfront home sales during February decreased 45.0% year-over-year at 11 closed transactions. Sales decreased by 15.4% from January. For all the Lake Martin Waterfront housing data, click here. Inventory: February listings (168) increased 20.1% from January and increased 17.5% from one

According to the Lake Martin Area Association of Realtors, waterfront home sales during January decreased 18.8% year-over-year at 13 closed transactions. Sales decreased by 31.6% from December. For all the Lake Martin Waterfront housing data, click here. Inventory: January listings (139) decreased 1.4% from December and increased 6.1% from one

According to the Lake Martin Area Association of Realtors, waterfront home sales during December increased 26.7% year-over-year at 19 closed transactions. Sales increased 72.7% from November. For all the Lake Martin Waterfront housing data, click here. Inventory: December listings (141) decreased 9.0% from November and decreased 26.2% from

According to the Lake Martin Area Association of Realtors, waterfront home sales during November decreased 42.1% year-over-year at 11 closed transactions. Sales decreased 52.2% from October. For all the Lake Martin Waterfront housing data, click here. Inventory: November listings (155) increased 1.3% from October and decreased 4.9% from one year

According to the Lake Martin Area Association of Realtors, waterfront home sales during October increased 4.5% year-over-year at 23 closed transactions. Sales decreased 30.3% from September. For all the Lake Martin Waterfront housing data, click here. Inventory: October listings (153) decreased 7.8% from September and decreased 20.7% from one year

According to the Lake Martin Area Association of Realtors, waterfront home sales during September increased 50.0% year-over-year at 33 closed transactions. Sales increased 17.9% from

According to the Lake Martin Area Association of Realtors, waterfront home sales during August increased 7.7% year-over-year at 28 closed transactions. Sales decreased 3.5% from


This website uses cookies to collect information to improve your browsing experience. Please review our Privacy Statement for more information.